
November 2026 Bay Area Market Update: One Region, Nine Different Markets
11 min read · Updated November 2026
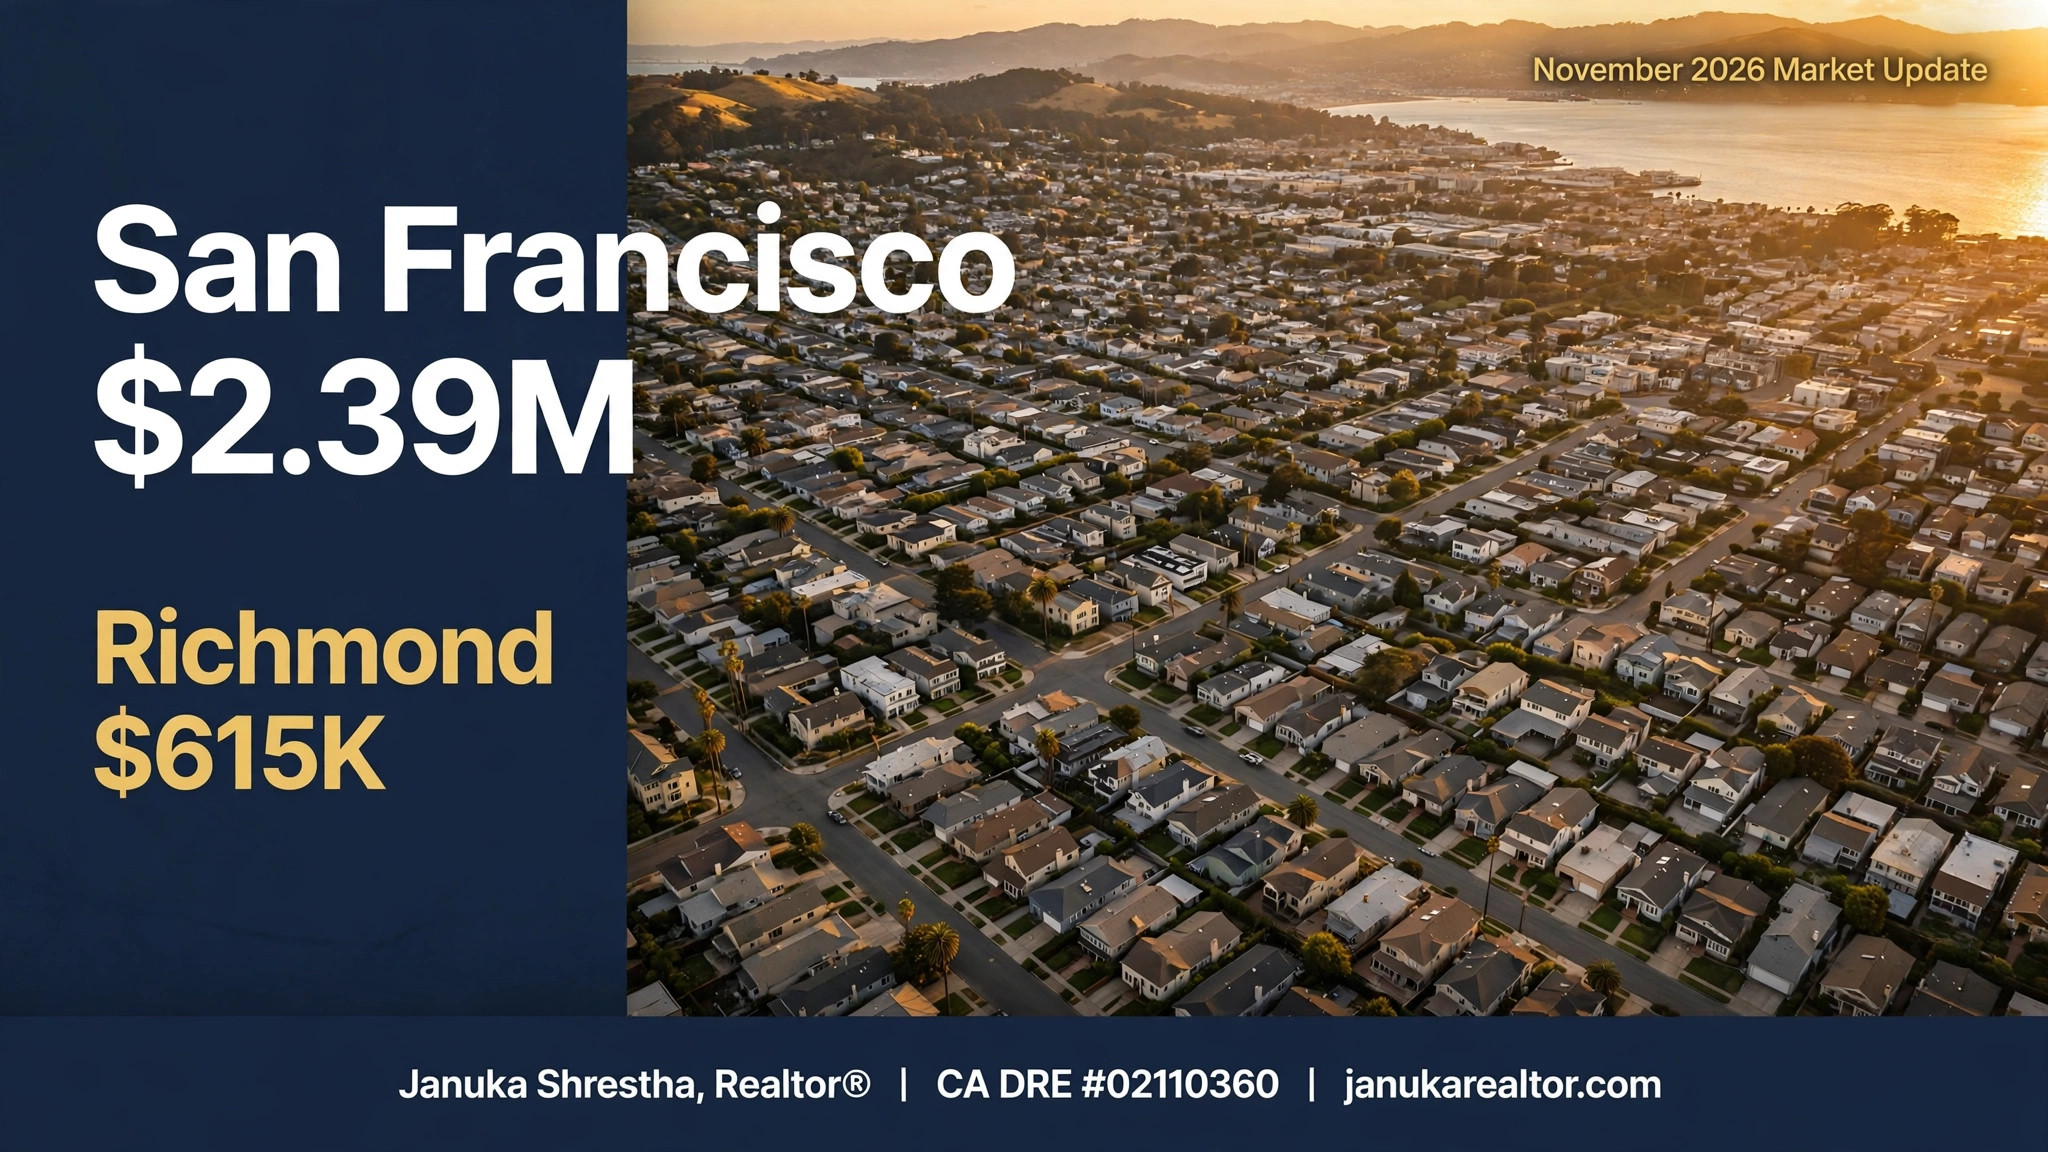
If you only watch the national housing news, you'd think the market is cooling everywhere. If you only watch the Bay Area, you'd think prices never stop climbing. Both are half right — and that's exactly why a Bay Area buyer needs local numbers, not national headlines. October's data shows one region with nine very different markets: San Francisco's median jumped nearly 30% in a year, while Contra Costa County — home to Richmond and El Cerrito — sits at $880,000. Borrowing costs, meanwhile, have eased for four straight weeks. Here's the whole Bay Area, county by county and city by city, in plain English.
The short answer
- The Bay Area median is $1,375,000, up 5.8% from a year ago — the strongest annual gain of any California region (C.A.R., October 2026).
- The gap inside the region is enormous: San Francisco County's median is $2,390,000; Contra Costa County's is $880,000 (C.A.R.).
- Richmond and El Cerrito are the region's most affordable entry points: Richmond's median sale price is $614,573 and El Cerrito's is $1,096,737 (Redfin, October 2026).
- Borrowing costs are easing: the average 30-year fixed rate has now fallen four weeks in a row (Freddie Mac) — the first sustained break buyers have had in months.
- Fewer sales, but no price crash: Bay Area sales fell 12.1% year over year, yet prices rose (C.A.R.). Sellers are holding firm; buyers who are prepared have more room to negotiate than they did two years ago.
The Bay Area by county
All figures below are median prices for existing single-family detached homes, October 2026, from the California Association of Realtors (C.A.R.) — the same source, so the counties compare fairly.
| County | Median price | Change vs. last year |
|---|---|---|
| San Francisco | $2,390,000 | +29.2% |
| San Mateo | $2,385,000 | +8.9% |
| Santa Clara | $2,062,500 | +5.8% |
| Marin | $1,805,000 | +7.4% |
| Alameda | $1,278,000 | +0.2% |
| Contra Costa | $880,000 | +2.3% |
| Bay Area (9 counties) | $1,375,000 | +5.8% |
For comparison, California's statewide median is $886,760, essentially flat year over year, with statewide sales of 246,830 (annualized) down 12.7% (C.A.R.). The Bay Area is outperforming the state on price — and that outperformance is concentrated in the city and the Peninsula.
San Francisco and the Peninsula: the hottest corner
San Francisco County posted the largest annual price jump of any county C.A.R. tracks — $2,390,000, up 29.2% year over year. The city's own MLS put the October single-family median at $2,375,000 (up 28.4%) and the condo median at $1,335,000 (up 11.3%). Redfin's metro-level data agrees on the direction: San Francisco led all major U.S. metros with prices up 16.8% year over year in October, driven by AI-sector wealth chasing scarce inventory — active listings in the city were down 7% from a year earlier (Redfin).
San Mateo County (the Peninsula) is right behind at $2,385,000, up 8.9% (C.A.R.). With less than two months of inventory across San Francisco, San Mateo, Santa Clara, and Alameda counties, the Peninsula and the city remain firmly seller's markets: well-priced homes still draw multiple offers, and buyers there should expect to compete.
What it means for buyers: if your budget is under $1.5M, the city and Peninsula are largely condo territory now. The single-family market there starts around $2M and moves fast.
The South Bay: strong, steadier, and bigger
Santa Clara County's median is $2,062,500, up 5.8% year over year (C.A.R.) — the same annual gain as the region overall. San Jose, the county's anchor city, had a median asking price of about $1,388,000 with homes taking roughly 37 days to sell (Redfin metro data, October 2026). New listings in San Jose rose 15.4% year over year — the biggest jump of any major U.S. metro — and active listings rose 22.5% (Redfin), so South Bay buyers are seeing more choice than they did a year ago, even at these prices.
The East Bay: where most first-time buyers actually shop
Alameda County's median is $1,278,000, essentially flat year over year (+0.2%) (C.A.R.) — the calmest of the big Bay Area counties. But the county average hides big differences between cities, so here are the city-level numbers for October 2026. Note the sources measure different things: Bay East figures are detached (single-family) homes; Redfin figures cover all home types, including condos.
- Berkeley: detached homes sold at a $1,800,000 median in October, with 66 sales and about 17 days on market (Bay East MLS). Redfin's all-types median is $1,165,000 — the gap shows how much condos pull the average down. Berkeley is the East Bay's fastest market.
- Oakland: detached median $1,105,000 with 200 sales and 25 days on market (Bay East MLS); Redfin's all-types median is $804,440, up 5.2% year over year. Oakland is the East Bay's volume leader — and its most affordable big city.
- Fremont: detached median $1,700,000 with 60 sales (Bay East MLS); the rolling three-month all-types median is $1,349,062 across 339 sales with about 2.0 months of supply (Redfin Data Center). Fremont had 33% more homes for sale than a year ago (Bay East) — the most inventory growth on the 880 corridor.
- Hayward: detached median $950,000 with 51 sales (Bay East MLS); Redfin's all-types median is $849,409, essentially flat year over year. Hayward remains one of the most affordable stops on BART.
Richmond and El Cerrito: the Bay Area's most affordable front door
This section matters to a lot of families in our community — Richmond and El Cerrito are home to many Nepali families, and they are also where a Bay Area paycheck stretches furthest.
Richmond: the median sale price across all home types is $614,573, down 0.9% from a year ago (Redfin, October 2026) — the lowest median of any Bay Area city in this update, and less than half the regional median. For single-family homes specifically, the third quarter of 2026 showed a $630,000 median on 111 sales, taking about 27 days (Red Oak Realty, Q3 2026). Condos and townhomes in Richmond (Bay East groups Richmond with El Cerrito and San Pablo) sold at a $540,000 median in October, taking about 61 days, with 4.1 months of inventory and buyers paying about 101% of list price (Bay East, October 2026). What that combination says: Richmond is the Bay Area's genuine entry point, and well-priced homes there still sell close to — or above — asking.
El Cerrito: the median sale price across all home types is $1,096,737, down 5.3% year over year (Redfin, October 2026). Single-family homes tell a slightly different story: the Q3 2026 median was $1.25M on 44 sales, down 10% from a year earlier — but that dip came mostly from smaller two-bedroom homes, while three-bedroom homes in the 1,000–2,000 sq ft range held flat at about $1.12–$1.13M, and homes still sold about 22% over asking in about 21 days (Red Oak Realty, Q3 2026). El Cerrito costs nearly twice Richmond, but it buys BART access, top-rated schools, and a 20-minute hop to San Francisco — and it has still gained 67% over the past ten years, the biggest decade gain of any East Bay city in that comparison.
The county context: Contra Costa County overall sits at $880,000, up 2.3% year over year (C.A.R.), so Richmond is well below its own county median while El Cerrito sits above it. For a first-time buyer, that spread is the opportunity: the same county, the same BART line, very different price tags depending on which side of the hills you're on.
The North Bay: Marin leads, quietly
Marin County's median is $1,805,000, up 7.4% year over year (C.A.R.) — and Marin was the only county in California where sales were unchanged from a year earlier, while 44 of 52 counties saw sales fall. It's a smaller, steadier market: fewer transactions, but prices holding and even climbing. For buyers priced out of San Francisco who want space and top schools, Marin remains the North Bay's benchmark.
The Tri-Valley, briefly
For completeness: the Tri-Valley (Pleasanton $1.65M, Dublin $1.485M, Livermore $1.043M, Bay East, October 2026) sits between Alameda County's median and the Peninsula's — Livermore remains the area's relative value play at just over $1M. The full Tri-Valley picture is in our earlier guides; this update's focus is the wider region.
What the easing rates actually mean for you
The average 30-year fixed rate has fallen four weeks in a row (Freddie Mac, week ending November 12) — the first real stretch of relief this year. A lower rate means a lower monthly payment on the same loan, and some buyers who were just short of qualifying a month ago may now qualify. But keep the size of it in perspective: rates are easing, not plunging. Fannie Mae's November 16 forecast expects rates to average around 7.2% through the end of 2026 and into 2027–28. If you're waiting for a big drop before you buy, you may be waiting a long time — and Bay Area prices have a habit of rising while you wait. Nationally, the median sale price is $388,634 (Redfin, October 2026) and the typical monthly payment is $2,755 (Redfin, four weeks ending November 8) — a useful reminder of how far Bay Area prices sit above the national norm.
How to use this window as a buyer
- Start with the county, then the city. The Bay Area's $1,375,000 median is an average of a $2.39M county and an $880K county. Your budget decides your map — work outward from what you can afford, not inward from where you'd ideally live.
- Get pre-approved now, not later. A pre-approval written at today's rates tells you exactly what you can afford — and it makes your offer stronger than a buyer who hasn't done the homework.
- Shop the payment, not the rate headline. Ask your lender to show you the monthly payment at a few price points. A $100,000 difference in price matters more to your monthly budget than a small rate move.
- Look where the value is. Richmond at about $615K and Hayward at about $849K are real single-family markets with BART access — not compromises, but starting points. Oakland at about $804K offers the region's biggest city inventory.
- Use the extra time. With more inventory and longer selling times than a year ago in most of the region, you can see more homes and compare. Don't let a seller's deadline rush you into the wrong house.
- Plan to stay put. At today's rates, buying makes the most sense if you'll stay at least five years. If you might move in two, renting and saving is still the smarter play.
Frequently asked questions
Where is the cheapest place to buy a home in the Bay Area?
Of the cities in this update, Richmond — median sale price about $615K across all home types (Redfin, October 2026). Contra Costa County overall is $880,000 (C.A.R.), the lowest county median in the region. Hayward (about $849K) and Oakland (about $804K) are the next most affordable larger cities.
Are Bay Area home prices falling?
No — not by the October numbers. The regional median is $1,375,000, up 5.8% from a year ago (C.A.R.), with San Francisco up 29.2%. Some individual cities and home types are softer — El Cerrito's all-types median is down 5.3% year over year (Redfin) — but the region as a whole is still rising.
Are mortgage rates going down?
They've eased for four straight weeks (Freddie Mac). But Fannie Mae's forecast expects rates to stay near current levels through 2027–28. Plan your budget at today's rates; treat any further drop as a bonus, not a plan.
How long are Bay Area homes taking to sell?
It depends on the city: Berkeley about 17 days, El Cerrito about 21, Oakland about 25, Richmond about 27 (single-family, Q3 2026), and Richmond condos about 61 days (Bay East). That's slower than the one-weekend frenzies of 2021–22, and much healthier for buyers.
What does 5.1 months of inventory mean?
It's the national measure of how long current listings would last at the current sales pace (NAR, October 2026: 1.59 million homes). Around 6 months is considered balanced — neither buyers nor sellers in control. Nationally we're close to balanced for the first time in years, though the Bay Area's hottest pockets remain well below that.
The bottom line
November's message is simple: there is no single "Bay Area market." There's a $2.39M market in San Francisco, a $1.28M market in Alameda County, and an $880K market in Contra Costa County — and within Contra Costa, Richmond at about $615K and El Cerrito at about $1.1M are two very different opportunities on the same BART line. Borrowing costs have finally started easing, and buyers have more breathing room than they've had in years. That's not a green light to buy anything — it's a green light to buy carefully, with a pre-approval in hand, a clear budget, and the right city for that budget. If you've been waiting for the market to give you a fair shot, this is the closest it's come in a while.
Want to know what your budget buys — in Richmond, El Cerrito, Hayward, or anywhere else in the Bay Area? Book a free strategy call and I'll pull current listings that fit — or start with what your home is worth.
Related reading: Tri-Valley Condo & Townhome Buyer's Guide · What Actually Sold in the Tri-Valley in Q3 2026 · Is Now a Good Time to Buy in the Tri-Valley? · What $1M Buys You in the Tri-Valley · Hayward Market Spotlight
Want to know what your budget buys in the Bay Area?
I'll pull current listings that fit your budget — in Richmond, El Cerrito, Hayward, or anywhere else in the region. Book a free strategy call, or start with the payment quiz.

Januka Shrestha, Realtor® · CA DRE #02110360
Nepali & Hindi-speaking Bay Area Realtor with S & R Homes Realty. More than 40 families served across the Tri-Valley, East Bay, and Silicon Valley.
Sources: California Association of Realtors (C.A.R.) October 2026 home sales and price report, released Nov 17, 2026 — Bay Area median $1,375,000 (+5.8% YoY), county medians (San Francisco $2,390,000 +29.2%, San Mateo $2,385,000 +8.9%, Santa Clara $2,062,500 +5.8%, Marin $1,805,000 +7.4%, Alameda $1,278,000 +0.2%, Contra Costa $880,000 +2.3%), statewide median $886,760 (flat YoY), CA sales 246,830 (−12.7% YoY), Bay Area sales −12.1% YoY; all C.A.R. county figures are existing single-family detached homes, not seasonally adjusted. National Association of Realtors (NAR) October 2026 existing-home sales — 3.75M SAAR (−5.5% MoM, −8.8% YoY, lowest since Aug 2010), median $416,700 (+0.4% YoY), inventory 1.59M / 5.1 months. Freddie Mac Primary Mortgage Market Survey, week ending Nov 12, 2026 — 30-yr fixed down for a fourth straight week (15-yr 6.45%). Redfin housing market data, October 2026 — Richmond median sale price $614,573 (−0.88% YoY, all home types), El Cerrito $1,096,737 (−5.3% YoY), Oakland $804,440 (+5.2% YoY), Hayward $849,409 (−0.07% YoY), San Francisco city $1,663,843 (+18.8% YoY, all types); Redfin metro data — San Francisco metro prices +16.8% YoY (largest gain of 50 largest metros), active listings in San Francisco down 7% YoY, San Jose new listings +15.4% YoY and active listings +22.5% YoY, national median sale price $388,634 (−0.4% YoY), typical payment $2,755 (four weeks ending Nov 8); Redfin Data Center via market tracker — Fremont rolling 3-month median $1,349,062 (Aug–Oct 2026, 339 sales, 2.0 months of supply). Bay East Association of Realtors MLS, October 2026 detached-home reports (via Paul Wong Group) — Berkeley $1,800,000 median, 66 sold, 17 DOM; Oakland $1,105,000, 200 sold, 25 DOM; Fremont $1,700,000, 60 sold; Hayward $950,000, 51 sold; Richmond condos/townhomes (grouped with El Cerrito and San Pablo) $540,000 median, 61 DOM, 4.1 months inventory, 101% of list. Red Oak Realty Q3 2026 single-family recap — Berkeley $1.70M (+8%, 17 days), Oakland $0.93M (+7%, 30 days), Richmond $0.63M (−4%, 27 days), El Cerrito $1.25M (−10%, 21 days, 3-bedroom homes flat at ~$1.12–$1.13M, ~22% over asking). San Francisco MLS via SFAR InfoSparks — October single-family median $2,375,000 (+28.4%), condo median $1,335,000 (+11.3%). Federal Reserve, Oct 28, 2026 — benchmark rate held at 3.75%–4.00%. Fannie Mae housing forecast, Nov 16, 2026 — rates averaging ~7.2% through end-2026 into 2027–28. Bay East Association of Realtors, October 2026 — Tri-Valley medians (Pleasanton $1.65M / 30 DOM, Dublin $1.485M / 35 DOM, Livermore $1.043M / 21 DOM). Data as of 11/18/2026. Methodologies differ by source and are noted per figure; medians can move sharply when a different mix of homes sells.