
What Actually Sold in the Tri-Valley in Q3 2026: Prices, Speed & Surprises
8 min read · Updated October 2026
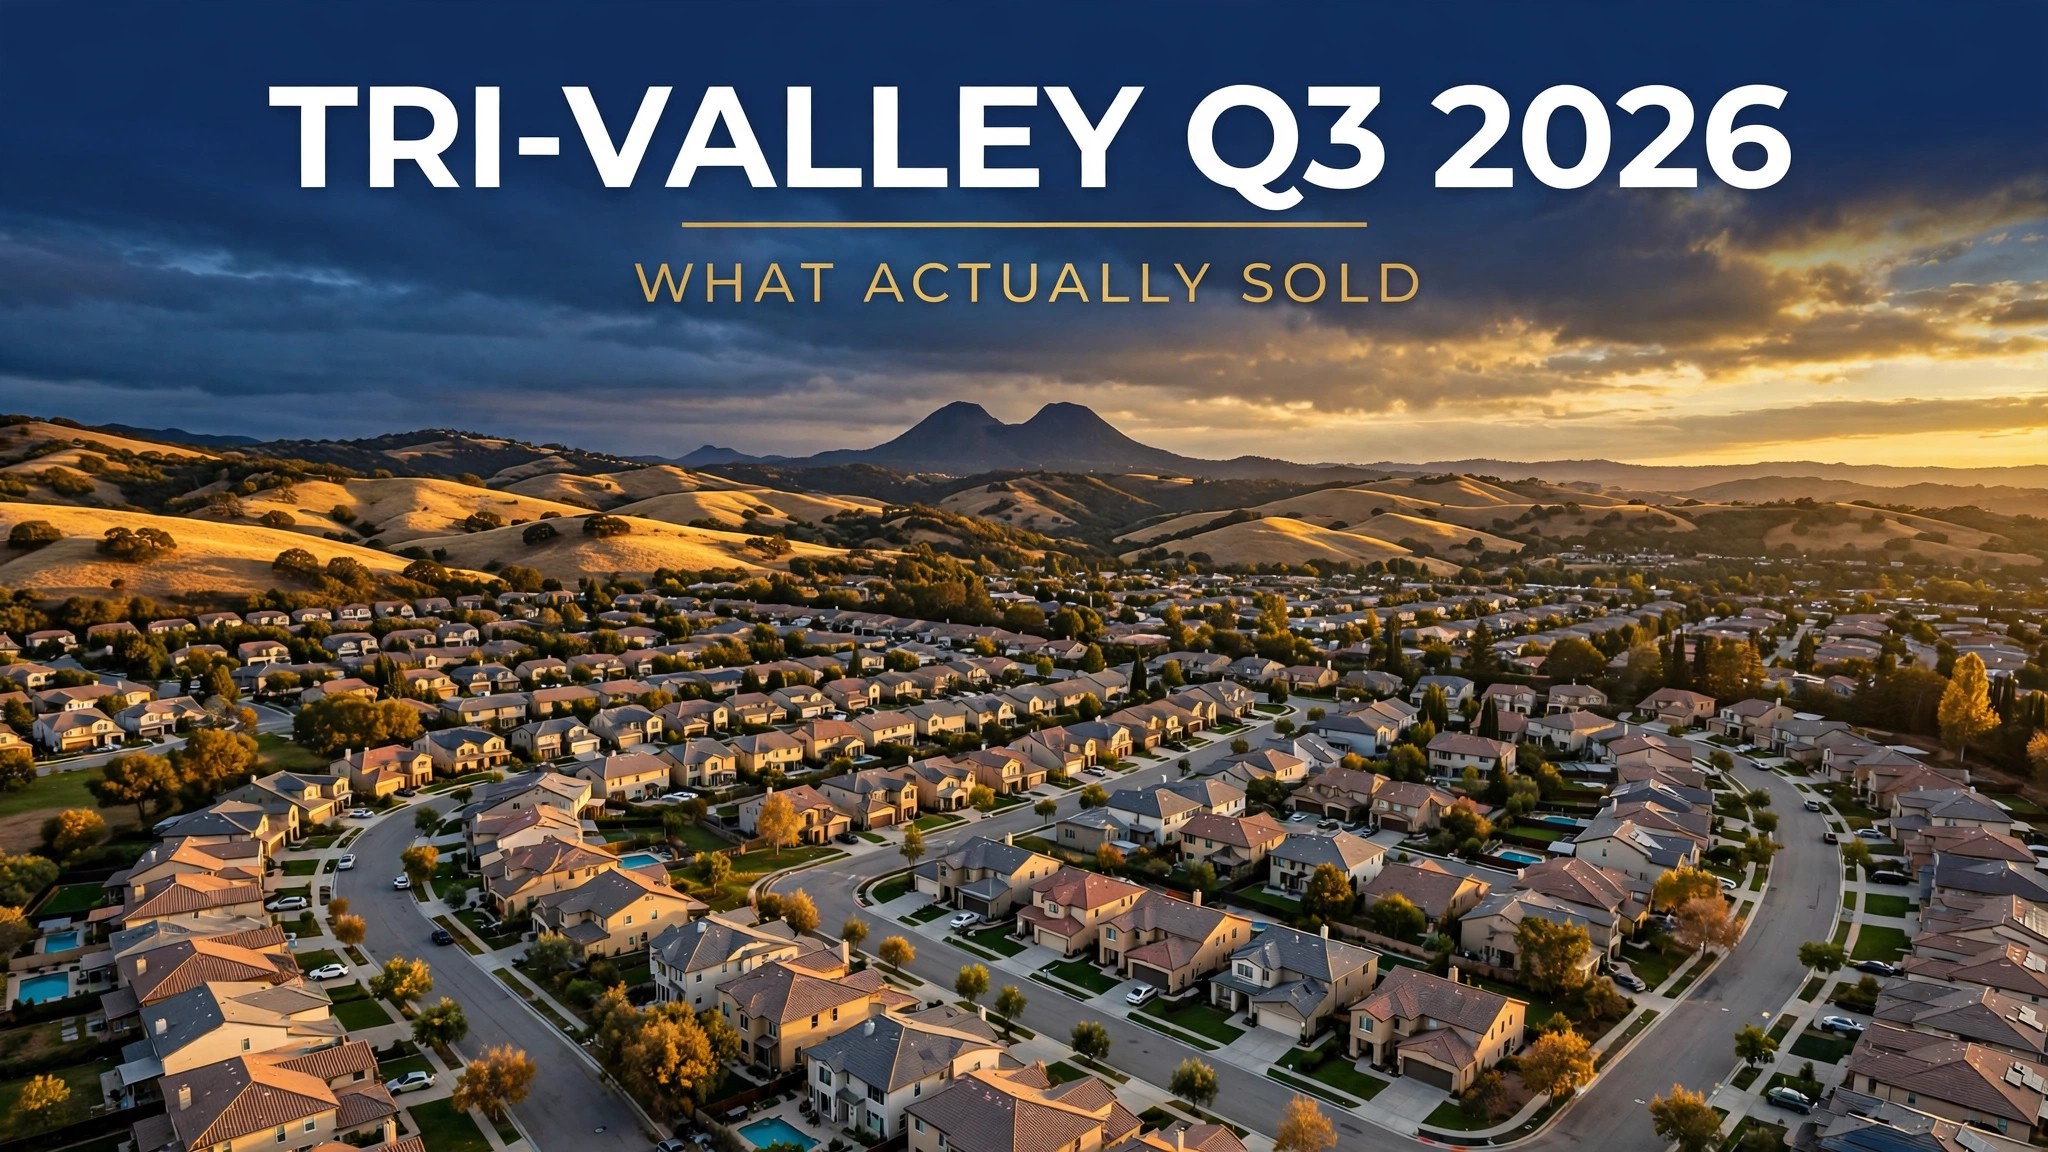
Asking prices are opinions. Sold prices are facts. So instead of another roundup of what's listed, here's what actually closed across the Tri-Valley in Q3 2026 (July–September) — the real medians, the real pace, and the patterns hiding underneath.
The Q3 2026 Tri-Valley scorecard
Short answer: Prices stabilized after the 2024–25 dip — no crash, no boom. But homes took noticeably longer to sell, sale prices slipped to 98–99% of asking almost everywhere, and the market split in two: competitively priced homes under $1.5M still drew over-asking offers, while overpriced and $2M+ homes sat and cut.
| City | Median sold (latest) | Trend | Pace | Sale-to-list |
|---|---|---|---|---|
| Pleasanton (single-family) | $1.59M (Sep) | +4.1% YoY* | 37 avg days | 98% |
| Dublin | $1.63M (Aug) | −3.1% YoY | 17 days | 98.1% |
| Livermore | $1.07M (Sep) | −3.4% YoY | ~40 days | 98% |
| San Ramon (single-family) | $1.74M (Aug) | +0.6% YoY | 24 days | 98.9% |
*Pleasanton's September bounce came against one of last year's softest months — see below. Sources vary by methodology (MLS vs. county records); each city's section names its source.
Pleasanton: a bounce, with an asterisk
Pleasanton's single-family median told a three-act story in Q3: down 6.5% year over year in July, down 9.7% in August ($1.5M), then up 4.1% in September to $1.59M.
Before anyone calls it a rebound: last September's $1,527,000 median was one of the softest readings in over a year, so this year's comparison was easy to beat. The steadier gauge — average price per square foot — eased to $816 in September, essentially flat with last September's $813. And six closings above $3M flattered September's average. Honest read: prices have stabilized, not taken off.
The clearer signal is pace. Average days on market hit 37 in September — the highest in 13 months, rising every month since April. Same story in volume: 40 closings vs. 53 a year ago, with nearly identical inventory (79 active listings vs. 81). Same supply, fewer sales, longer waits: months of supply rose to 2.0 from 1.6.
Dublin: the volume exception
Dublin was the Tri-Valley's busiest story in August: 31 sales, up 24% year over year — the only Alameda County city where sales grew — with a $1.63M median (−3.1% YoY), 17 days on market, and 98.1% sale-to-list (C.A.R.). County records for August show a $1,375,000 median across all property types with 71 total sales.
September's Redfin read: the median held roughly flat (+0.7% YoY), but the average price fell ~4% and price per square foot dropped ~15% — a classic mix shift, meaning more smaller and entry-level homes sold, not that the same homes lost value. With 133 active listings and about 1 in 5 sellers cutting price, Dublin buyers currently have the most breathing room in the Tri-Valley. More on the city in my Dublin guide.
Livermore: where speed literally paid
Livermore closed 79 sales in September at a median of $1,069,500, averaging 98% of original asking (Compass Market Pulse). Overall medians remain the softest in the Tri-Valley — around −3.4% year over year — but the segment data is where it gets useful:
- Sold in under 15 days → 102% of asking. 15–30 days → 99%. 31–60 days → 94%. Over 60 days → 93%.
- $1M–$1.5M homes averaged 101% of list. $1.5M–$2M averaged 100%. Above $2M: 96% of list and 51 average days.
- One in four sales closed above asking — while 27% of sellers cut their price first.
Read that again if you're selling: in Livermore this quarter, the first two weeks were worth roughly 8–9 points of sale price versus sitting for two months. Pricing right at launch isn't a slogan; it's the whole game.
San Ramon: the steady one
San Ramon did what San Ramon does — stayed expensive and calm. August: $1.74M single-family median (+0.6% YoY), 42 sales (flat), 98.9% sale-to-list, 24 days on market, with listings up ~20% giving buyers more to choose from (C.A.R.). September county records show a $1,362,500 median across all property types, 60 sales, and buyers paying 99.2% of asking; about 18% of September sales were cash. Asking prices sit ~26% below the June 2022 peak — a reset that's already happened, quietly.
The three patterns that defined Q3
- Speed = money. Every dataset says the same thing: homes that sold fast sold at or above asking; homes that sat sold for 93–98%. Days on market rose across the region all quarter.
- Two markets, one map. Under ~$1.5M: still competitive. Over $2M: slow, negotiated, price-cut. Your experience of "the market" depends entirely on which band you're in.
- Stabilization, not a rebound. $/sqft roughly flat, sale-to-list at 98–99%, volume down. Q3 2026 was the quarter the Tri-Valley stopped falling and started negotiating.
What this means heading into Q4
Buyers: You have time and leverage you didn't have in 2021 — use them on the homes that have sat 30+ days, where sellers have already cut once. But the good ones under $1.5M still move in two weeks; be ready.
Sellers: The quarter's data punishes wishful pricing and rewards sharp launch pricing. A home priced to the Q3 comps sells near (or above) asking in weeks; a home priced to 2022 sells in two months for ~93–94% of a number that was too high anyway.
Related reading: Is Now a Good Time to Buy in the Tri-Valley? (Fall 2026 Q&A) · What $1M Buys You in the Tri-Valley · Hayward Market Spotlight
Frequently asked questions
What was the median home price in the Tri-Valley in Q3 2026?
By city: Pleasanton single-family $1.59M (September), Dublin $1.63M (August), Livermore ~$1.07M (September), and San Ramon single-family $1.74M (August). Livermore remains the most affordable entry; San Ramon the priciest and steadiest.
Are Tri-Valley home prices recovering in 2026?
They've stabilized. Pleasanton's September median rose 4.1% year over year, but against a soft comparison month, and price per square foot is essentially flat. Dublin is roughly flat, Livermore is down ~3.4%, San Ramon up ~0.6%. It's stabilization, not a new boom.
How long did Tri-Valley homes take to sell in Q3 2026?
Longer than a year ago. Pleasanton's average hit 37 days in September (a 13-month high); Livermore averaged ~40 days; Dublin and San Ramon were faster at ~17–24 days on their August readings. Well-priced homes still sold in under two weeks.
Did homes sell above or below asking in Q3 2026?
Slightly below, on average — sale-to-list ratios ran 98–99% in most cities. But fast-selling homes still beat asking (102% for Livermore homes sold within 15 days), while homes on the market 60+ days averaged ~93%.
The bottom line
Q3 2026 in the Tri-Valley: real prices, real patience. The frenzy is gone, the crash never came, and what's left is a negotiator's market where the first two weeks of a listing matter more than any headline. Whether you're buying or selling this fall, the winning move is the same: price (or offer) off what actually sold — not what someone's asking.
Want the Q3 comps for your street?
I'll pull what actually sold near you and what it means for your home's value or your buying budget. Book a free strategy call, or start with the payment quiz.

Januka Shrestha, Realtor® · CA DRE #02110360
Nepali & Hindi-speaking Bay Area Realtor with S & R Homes Realty. More than 40 families served across the Tri-Valley, East Bay, and Silicon Valley.
Sources: Pleasanton MLS market reports Jul–Sep 2026 (katiemoerealtor.com); California Association of Realtors (C.A.R.) August 2026 city data; Livermore Market Pulse Report, September 2026 (The 680 Group at Compass); realty.com county-record data for Dublin (Aug 2026) and San Ramon (Sep 2026); Redfin September 2026 data via Cornerstone Real Estate Team; Houzeo Livermore market data (Sep 2026); Dynamic.RE city dashboards (data through Sep 2026); realtor.com Alameda County report (through Sep 2026). Data retrieved 10/23/2026. Methodologies differ by source (MLS closings vs. county records; single-family vs. all property types) and are noted per figure. Educational content only — not financial, tax, or legal advice. All information deemed reliable but not verified.