
August 2026 Bay Area Market Report: Median Home Prices by City
9 min read · Updated October 2026 · Data: C.A.R. August 2026

August is behind us, and the California Association of REALTORS® has released the August 2026 numbers. I went through the county reports and the city-level data so you don't have to — here is what the East Bay market actually looks like right now, in plain English.
Key takeaways
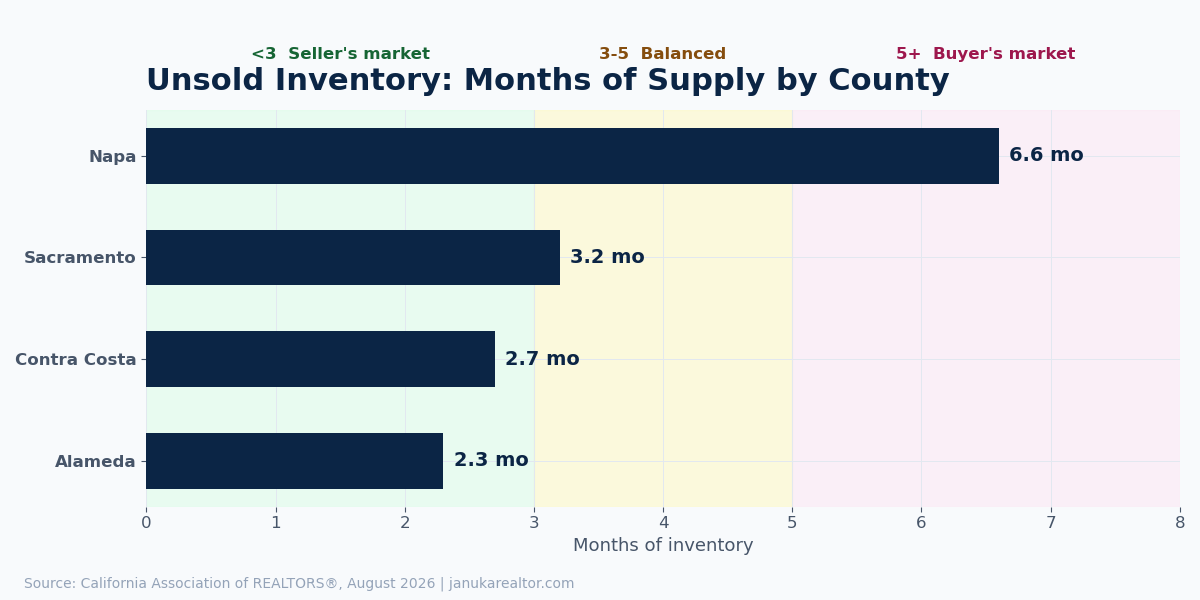
- Alameda County: median $1,285,000 (+1.3% YoY), 2.3 months inventory — still a seller's market.
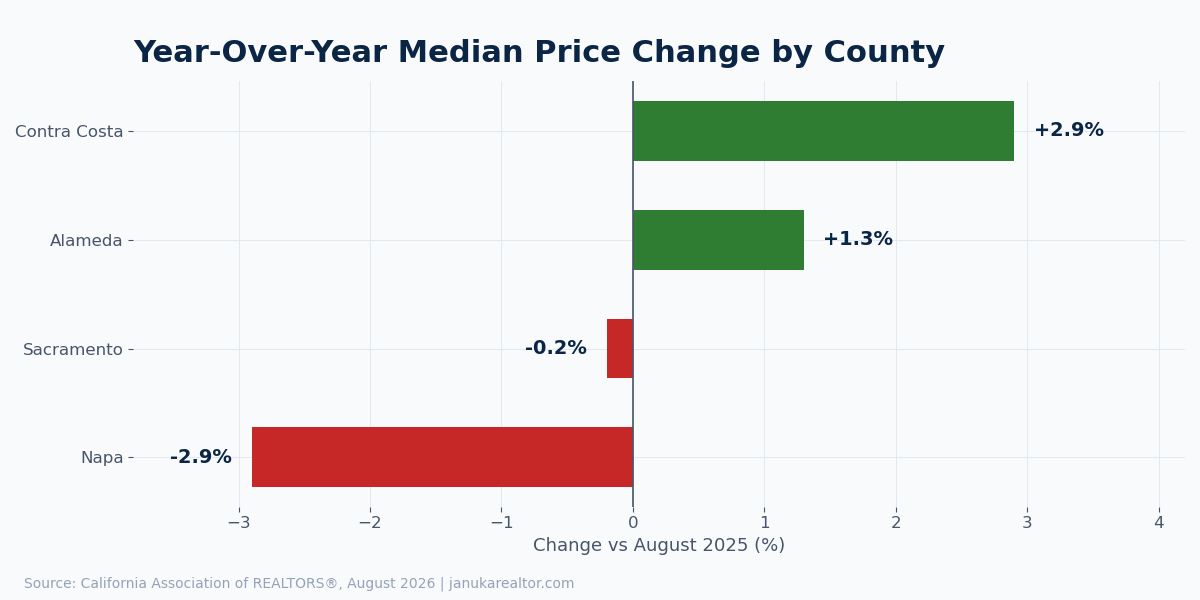
- Contra Costa County: median $875,000 (+2.9% YoY) — the strongest price growth of the four counties.
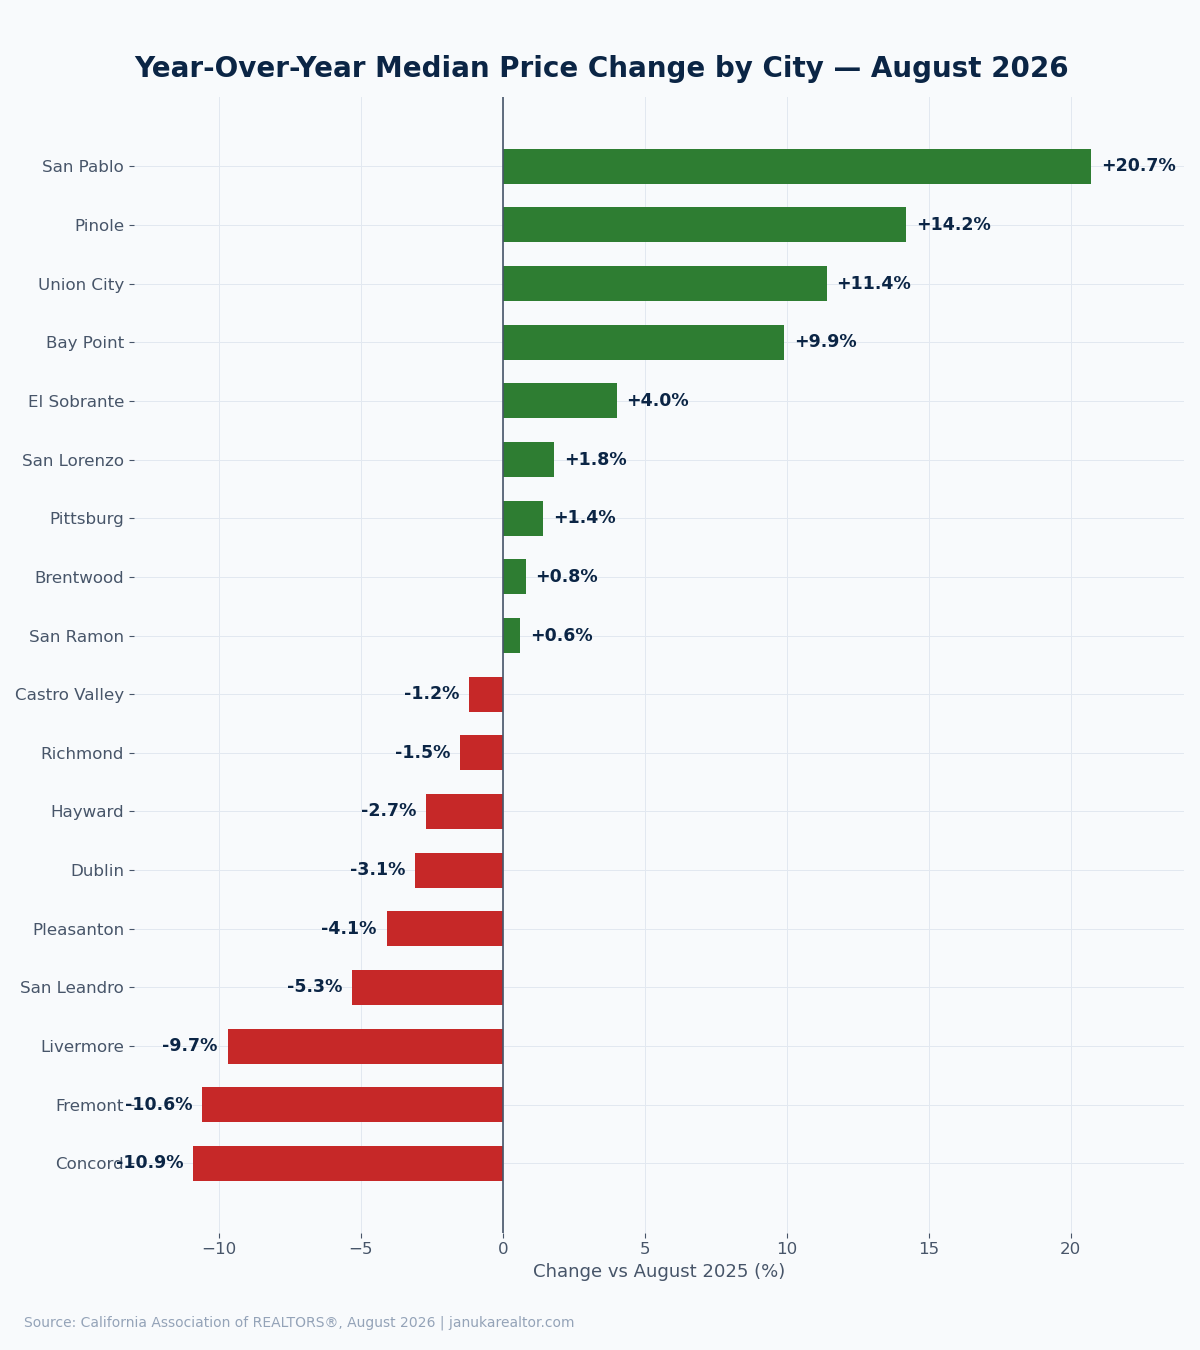
- Biggest price drops: Concord (−10.9%), Fremont (−10.6%), Livermore (−9.7%).
- Biggest price jumps: San Pablo (+20.7%), Pinole (+14.2%), Union City (+11.4%).
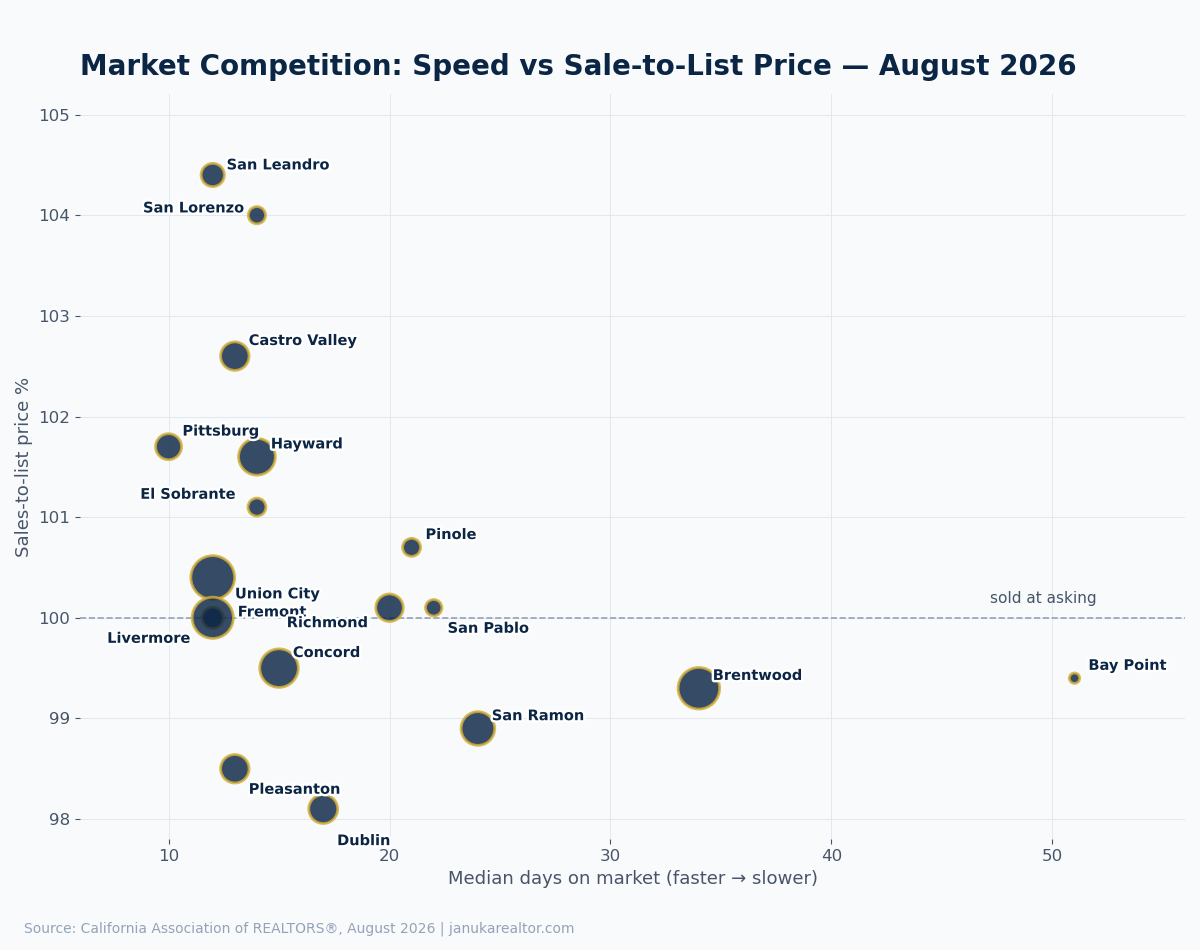
- Speed: most cities sell in 10–17 days; San Leandro averages 4.4% over asking.
The big picture: 4 counties
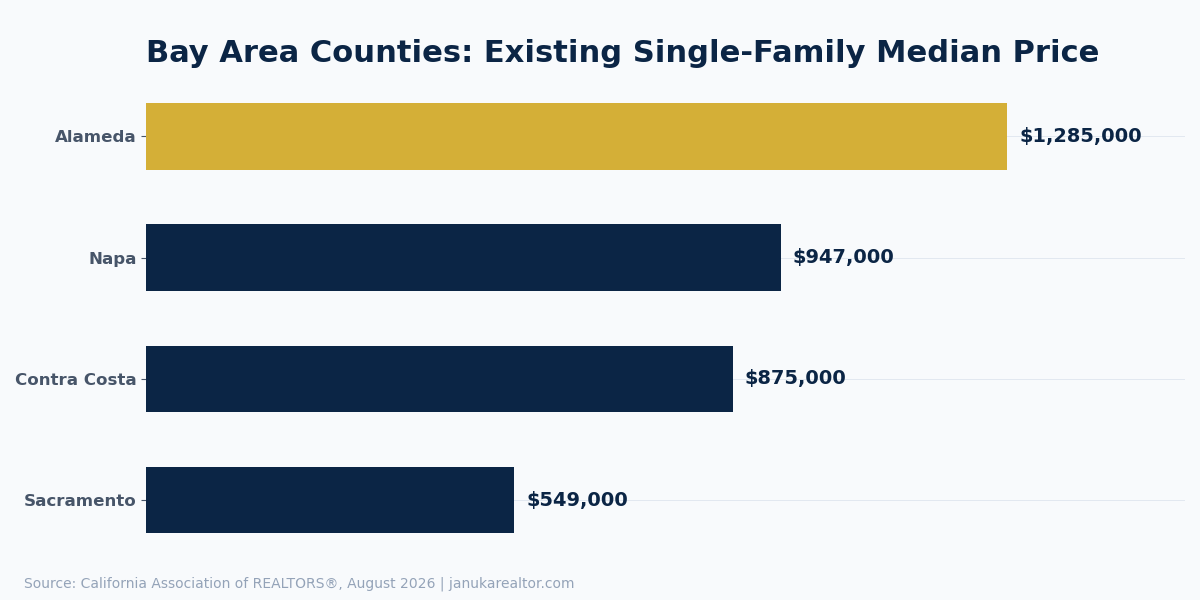
| County | Median Price | vs Last Year | Home Sales (YoY) | Inventory | Days on Market |
|---|---|---|---|---|---|
| Alameda | $1,285,000 | +1.3% | −8.8% | 2.3 months | 14 |
| Contra Costa | $875,000 | +2.9% | −4.1% | 2.7 months | 20 |
| Napa | $947,000 | −2.9% | +23.9% | 6.6 months | 91 |
| Sacramento | $549,000 | −0.2% | +2.0% | 3.2 months | 25 |
Alameda County held firm — median $1.285M, up 1.3% from last year, with just 2.3 months of inventory. That is firmly a seller's market: homes move in 14 days.
Contra Costa County actually grew — median $875K, up 2.9% year over year, the strongest price growth of the four counties, with 2.7 months of inventory.
Napa is the outlier: prices slipped 2.9% to $947K while sales jumped 23.9% — and with 6.6 months of inventory and 91 days on market, buyers there have real negotiating power.
Sacramento stayed flat at $549K with a balanced 3.2 months of inventory.
Alameda County: city by city
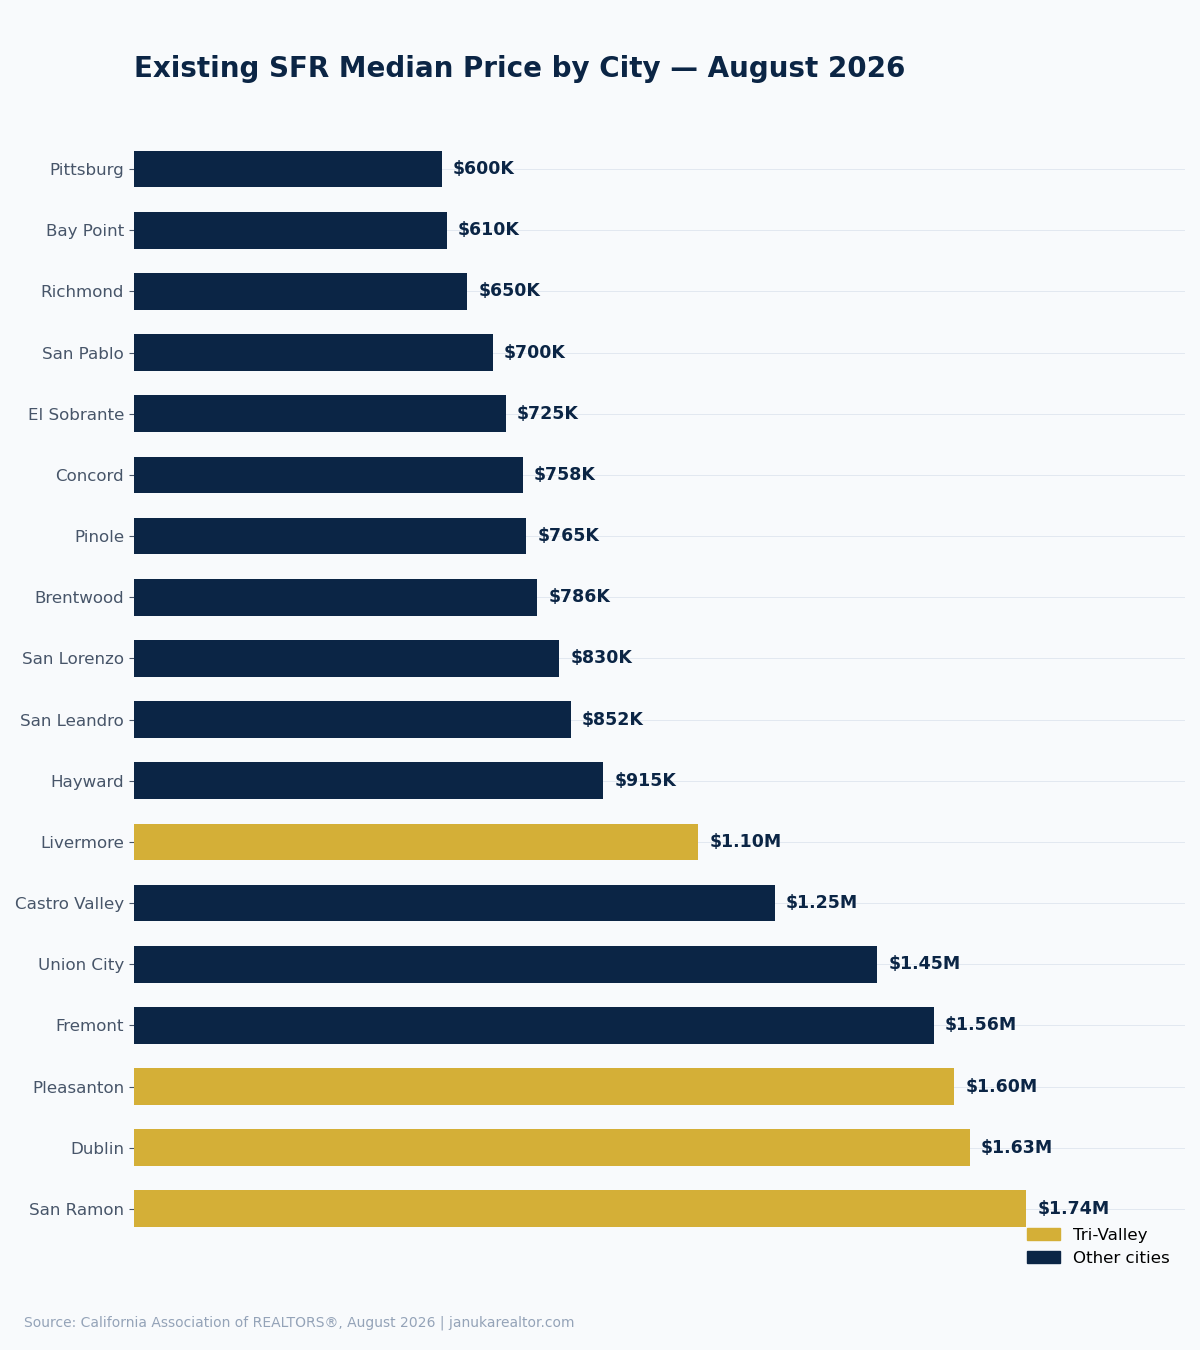
Dublin — $1.63M (−3.1% YoY)
31 sales (+24.0%), 74 active listings (+21.3%), 17 days on market, 98.1% sale-to-list. Dublin is the only Alameda city where sales grew — up 24% — with more listings to choose from. Buyers have the most breathing room here in the Tri-Valley. See Dublin homes & local guide →
Pleasanton — $1.60M (−4.1% YoY)
30 sales (−26.8%), 59 listings (−29.8%), 13 days on market, 98.5% sale-to-list. Listings fell nearly 30% — the tightest supply in the Tri-Valley — so well-priced homes still move in under two weeks. See Pleasanton homes & local guide →
Fremont — $1.56M (−10.6% YoY)
71 sales (−18.4%), 113 listings (+8.7%), 12 days on market, 100.4% sale-to-list. The biggest price adjustment in the county at −10.6%, yet homes still sell at full asking in 12 days. More listings than last year means buyers can finally negotiate. See Fremont homes & local guide →
Union City — $1.45M (+11.4% YoY)
17 sales (−29.2%), 32 listings (−11.1%), 12 days on market, 100.0% sale-to-list. The strongest price growth in Alameda County at +11.4% — even as sales slowed, values kept climbing. See Union City homes & local guide →
Castro Valley — $1.25M (−1.2% YoY)
30 sales (−3.2%), 38 listings (−26.9%), 13 days on market, 102.6% sale-to-list. Barely any price change, and sellers still get 2.6% over asking. Steady as it gets.
Livermore — $1.10M (−9.7% YoY)
63 sales (−10.0%), 90 listings (−15.9%), 12 days on market, 100.0% sale-to-list. A real price reset at −9.7% — Livermore is now the most affordable Tri-Valley city by a wide margin, and homes still sell at asking in 12 days. See Livermore homes & local guide →
Hayward — $915K (−2.7% YoY)
50 sales (−15.3%), 90 listings (−18.2%), 14 days on market, 101.6% sale-to-list. Modest price dip, but sellers average 1.6% over asking — demand is alive under $1M. See Hayward homes & local guide →
San Leandro — $852K (−5.3% YoY)
20 sales (−20.0%), 47 listings (−29.9%), 12 days on market, 104.4% sale-to-list. The hottest competition in the county: homes sell 4.4% over asking in 12 days.
San Lorenzo — $830K (+1.8% YoY)
11 sales (−21.4%), only 9 listings (−47.1%), 14 days on market, 104.0% sale-to-list. Inventory nearly halved — with just 9 active listings, bidding wars are the norm here (4% over asking on average).
Contra Costa County: city by city
San Ramon — $1.74M (+0.6% YoY)
42 sales (flat), 67 listings (+19.6%), 24 days on market, 98.9% sale-to-list. The priciest city in this report and the steadiest — prices essentially flat, with more listings giving buyers time to decide (24 days on market is the longest in the Tri-Valley area). See San Ramon homes & local guide →
Concord — $758K (−10.9% YoY)
55 sales (+3.8%), 106 listings (−19.7%), 15 days on market, 99.5% sale-to-list. The sharpest price drop in Contra Costa at −10.9% — but sales ticked up, a sign buyers are jumping on the lower prices.
Brentwood — $786K (+0.8% YoY)
64 sales (+56.1%), 125 listings (−28.2%), 34 days on market, 99.3% sale-to-list. The sales star of the county: +56% more homes sold than last year. Newer homes, family buyers, and it shows.
Pinole — $765K (+14.2% YoY)
12 sales (+20.0%), 18 listings (−14.3%), 21 days on market, 100.7% sale-to-list. Second-strongest price growth in the whole report at +14.2%.
El Sobrante — $725K (+4.0% YoY)
12 sales (−25.0%), 23 listings (+4.5%), 14 days on market, 101.1% sale-to-list. Prices up 4% and sellers get over asking — a quiet pocket of strength.
San Pablo — $700K (+20.7% YoY)
10 sales (−23.1%), 30 listings (+15.4%), 22 days on market, 100.1% sale-to-list. The biggest price jump in the entire report: +20.7%. Affordable Bay Area cities are where the growth is.
Richmond — $650K (−1.5% YoY)
28 sales (−37.8%), 72 listings (−45.0%), 20 days on market, 100.1% sale-to-list. Listings collapsed 45% — the few homes that do list sell at asking.
Bay Point — $610K (+9.9% YoY)
4 sales (−50.0%), 12 listings (flat), 51 days on market, 99.4% sale-to-list. Small sample (4 sales), but prices up nearly 10% — and at $610K it's the most affordable city in this report.
Pittsburg — $600K (+1.4% YoY)
25 sales (−3.8%), 67 listings (+26.4%), 10 days on market, 101.7% sale-to-list. The fastest-moving market in the report: 10 days on market, selling 1.7% over asking. Affordable + fast = fierce competition.
What this means for you
If you're buying: The price drops in Fremont (−10.6%), Concord (−10.9%), and Livermore (−9.7%) are real openings — these cities corrected while still selling at or near asking, which means demand is intact. Under-$800K cities like Pittsburg, Bay Point, and Richmond move fast (10–20 days), so have your pre-approval ready before you tour.
If you're selling: Low inventory is still your best friend. San Lorenzo (9 listings), Richmond (−45% listings), and Pleasanton (−30% listings) show what happens when supply dries up — multiple offers and over-asking sales. Price it right from day one: cities where 30–45% of listings took price cuts are telling you the market punishes overpricing. My home pricing guide covers how to find that number.
The bottom line: This is not one market — it's 18 micro-markets. Your zip code matters more than the county headline.
Frequently asked questions
What was the median home price in Alameda County in August 2026?
$1,285,000 for an existing single-family home, up 1.3% from a year earlier (C.A.R.).
What was the median home price in Contra Costa County in August 2026?
$875,000, up 2.9% year over year — the strongest price growth of the four counties tracked.
Which Bay Area cities had the biggest price drops?
Concord (−10.9%), Fremont (−10.6%), and Livermore (−9.7%).
Which Bay Area cities had the biggest price gains?
San Pablo (+20.7%), Pinole (+14.2%), and Union City (+11.4%).
Is the East Bay a buyer's or seller's market right now?
Still a seller's market in most cities: Alameda County had 2.3 months of inventory and Contra Costa 2.7 months (under 3 favors sellers), with most homes selling in 10–17 days, many above asking.
Want your city's numbers explained for your situation?
Book a free strategy call — we'll talk through your timeline, your numbers, and what your specific city means for your plan.

Januka Shrestha, Realtor® · CA DRE #02110360
Nepali & Hindi-speaking Bay Area Realtor with S & R Homes Realty. More than 40 families served across the Tri-Valley, East Bay, and Silicon Valley.
Data: California Association of REALTORS® Monthly Market Reports, August 2026. Existing single-family homes; median prices and year-over-year changes as reported. Educational content only — not financial, tax, or legal advice. Market conditions change frequently; confirm current details with your lender and tax advisor. Talk to qualified professionals about your specific situation.